Welcome to Axel Tracker
A complete beginner’s guide: understand the layout, import your first trades, and build your daily review habit.
Welcome to Axel Tracker! This guide walks you through everything you need to start journaling your trades, reading your performance, and building better habits — from your very first login.
Understanding the layout
Once you sign in, you land on your Dashboard — your home base. Here is how the screen is organized:
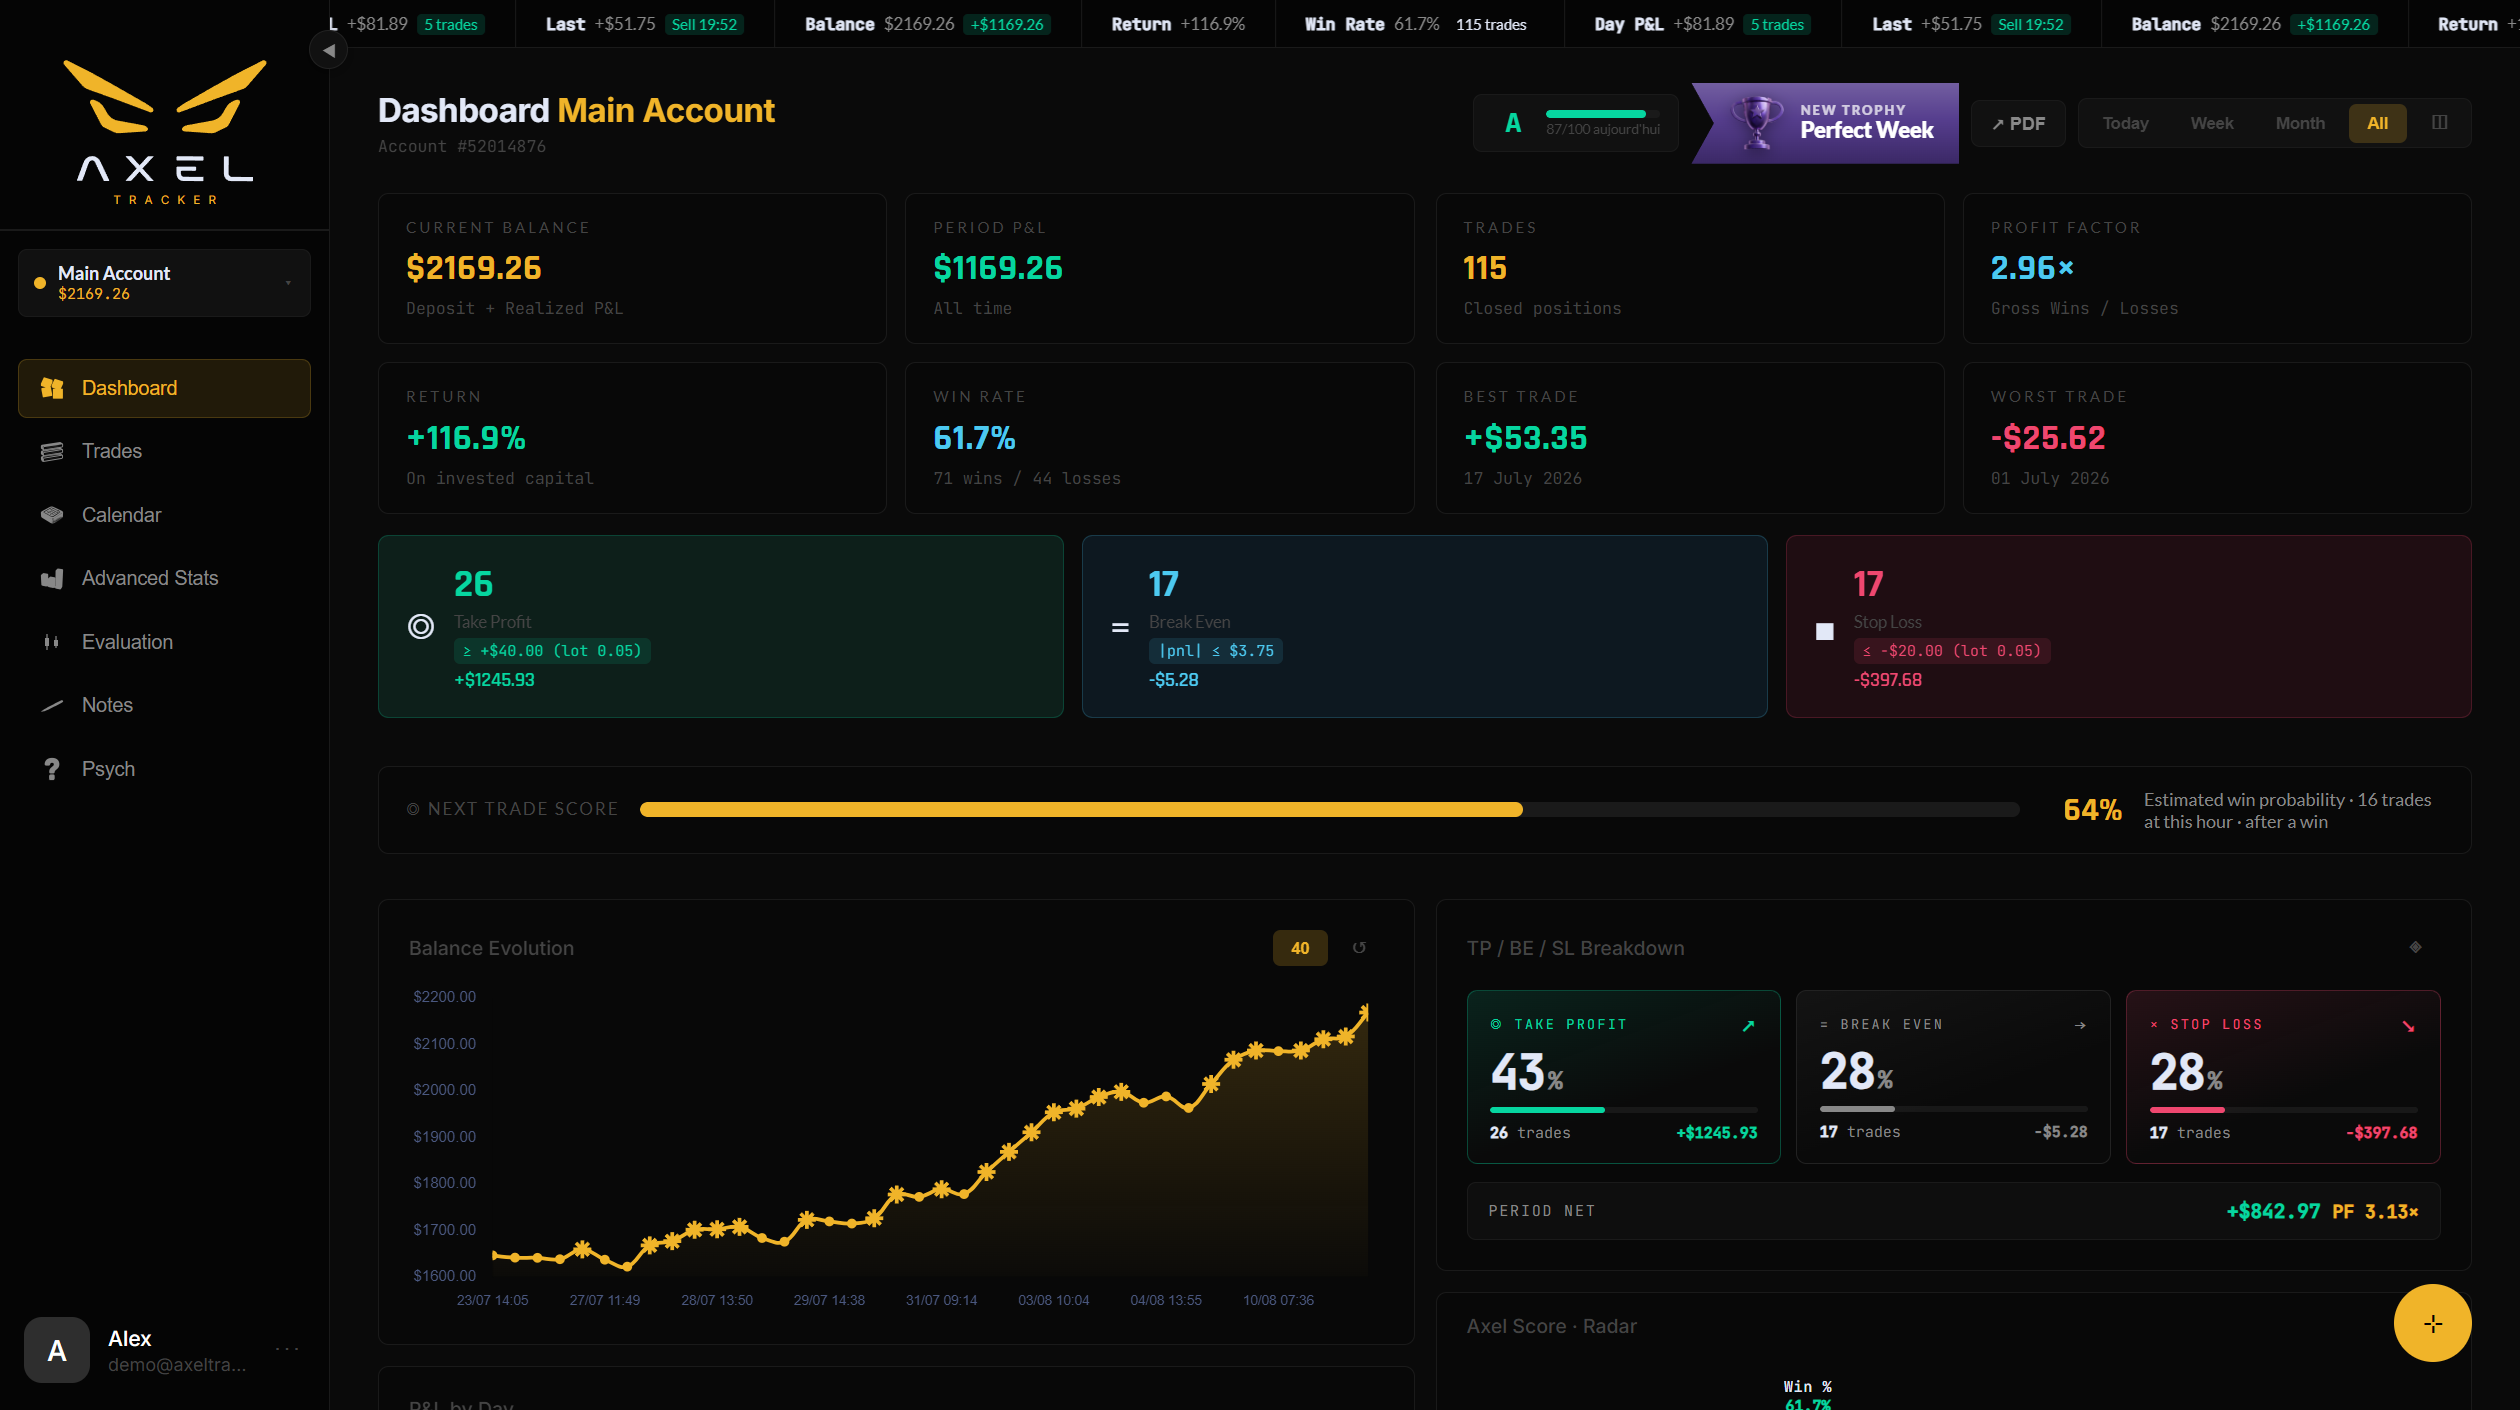
The Dashboard: KPIs, balance curve, and your customizable widget grid.
- Left sidebar — your main navigation: Dashboard, Trades, Calendar, Advanced Stats, Backtesting, Notes and Psychology. At the top sits the account switcher (your trading accounts, with the current balance); at the bottom, your profile menu.
- Top of the Dashboard — the period filter (Today / Week / Month / All / custom date), the day score badge and the PDF report button.
- Bottom-right corner (⊹ button) — the quick customization panel: accent color, widget style, theme, fonts, layout editing, and more.
- Bottom bar (ticker) — a scrolling strip showing your live trading stats, or your Vision Board images. You can hide it or change its speed from the ⊹ panel.
A colored dot next to your account name shows how that account is fed: green = Auto-Sync active, yellow = CSV imports, red = manual entry.
Get your first trades in
Axel gives you three ways to fill your journal:
- Auto-Sync (recommended) — connect your trading platform (MetaTrader 5, OANDA, TradeLocker…) and every closed trade lands in your journal on its own. Go to Trades → Auto-Sync and follow the in-app wizard. See how Auto-Sync works.
- CSV import — export a Closed Trades Report from MT5 and drop the file into Trades → Import CSV. Duplicates are skipped automatically.
- Manual entry — click + New Trade on the Trades page and fill in the form.
Once trades are in, head back to the Dashboard and watch your stats come to life.
What’s in the sidebar? (navigation guide)
- Dashboard — your bird’s-eye view: balance, P&L, win rate, profit factor, charts, and a fully rearrangeable widget grid.
- Trades — the master list of every trade: search, filter, sort, edit, plus the Timeline view and Deposits & Withdrawals.
- Calendar — monthly P&L view, real economic calendar, hourly heatmap, and monthly candlestick summary.
- Advanced Stats — session reports, drawdown analysis, Sharpe / Sortino / Kelly / Z-score, correlations, and streaks.
- Backtesting — a live TradingView chart, a macro world map, a projection simulator based on your real history, and side-by-side account comparison.
- Notes — your notebook: strategies, setups, lessons, plus a guided trade journal with a weekly psychology summary.
- Psychology — the daily check-in, behavioral patterns, plan-adherence tracking, and your Achievements.
Your daily workflow
Here is the routine we recommend to get the most out of Axel every day:
- Before you trade — open the Economic calendar and check the day’s high-impact events (3★ events also appear as an alert banner on your Dashboard).
- After your session — let Auto-Sync bring the trades in (or import your CSV), then review each one: check the outcome classification (TP / BE / SL), attach a strategy, add a note.
- End of day — take the daily psych check-in (2 minutes, 9 questions). It powers your discipline score, your emotional charts, and several achievements.
Consistency beats intensity. The check-in streak and the achievement tiers (Bronze → Master) are there to reward showing up daily — not to reward risk.
What’s next?
- Make the workspace yours — accent color, widget style, background, fonts.
- Rearrange your Dashboard — drag widgets, add optional ones, pin your favorite achievement badges.
- Set up strategies — tag your notes as Strategy and start measuring which setups actually pay.
- Add your other accounts — each account keeps its own data, theme and settings.
Still stuck? Contact support — or send feedback from the app: profile menu → Settings → Feedback.