The simulator — project your curve 1, 3 and 6 months out
Projections from your real expectancy, five scenarios, and the automatic lot-scaling plan.
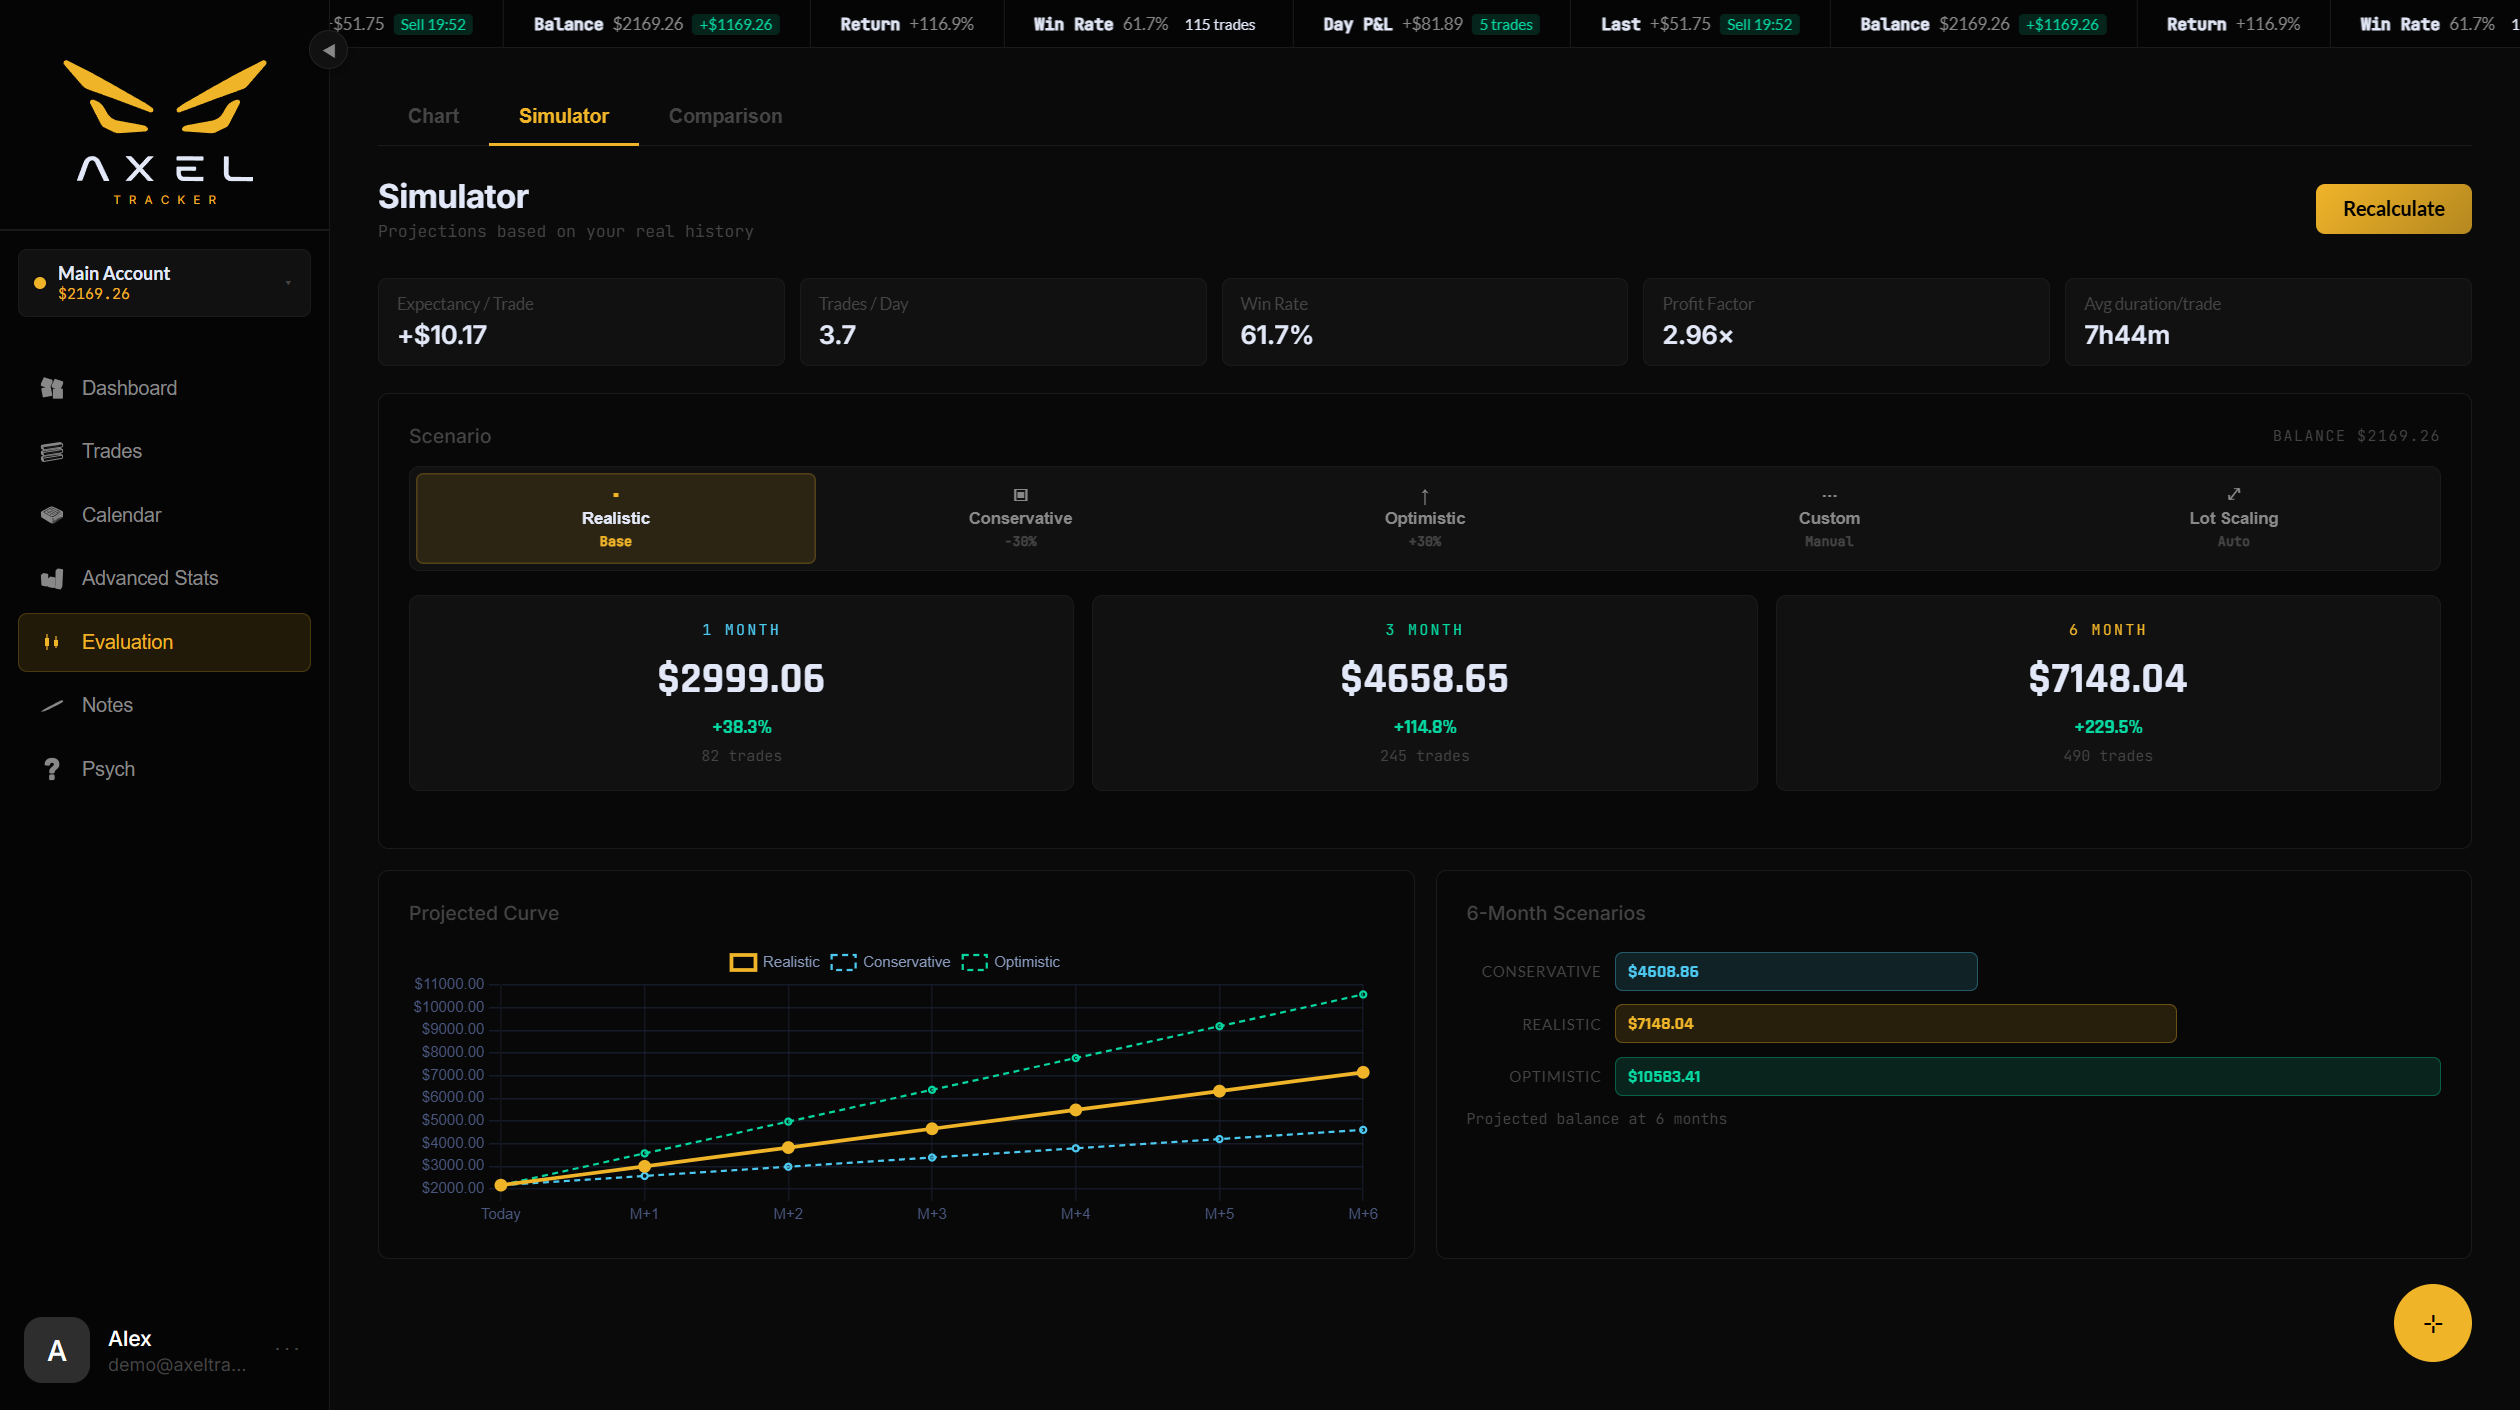
Backtesting → Simulator answers “where does my current edge take me?” It reads your real history — expectancy per trade, trades per day, win rate, profit factor, average duration — and projects your balance 1, 3 and 6 months forward.
The five scenarios

The scenario selector — Lot Scaling is the compounding one, detailed below.
| Scenario | Assumption |
|---|---|
| Realistic | Your numbers, as they are. |
| Conservative | Your expectancy degraded by 30%. |
| Optimistic | Your expectancy improved by 30%. |
| Custom | You type the expectancy, trades/day and days/month yourself. |
| Lot scaling | Position size grows with the balance — see below. |
The projected curve and the “scenarios at 6 months” card update on Recalculate. The projection widget can also be pinned to your Dashboard.
Lot scaling — the compounding plan, step by step
The four fixed scenarios keep your position size constant. Lot Scaling is the honest version of “when do I get to $10k?”: your edge per trade stays exactly what your history says it is — only the size grows with the balance, tier by tier. Here is how to use it and how to read what it shows.
1. Set the frame
Four inputs at the top of the panel:
- Starting balance — where the projection begins (pre-filled with your real balance).
- Target — the balance you’re aiming for.
- Trades / day and days traded / month — your realistic pace, not your ambitious one.
2. Read (and edit) the lot tiers
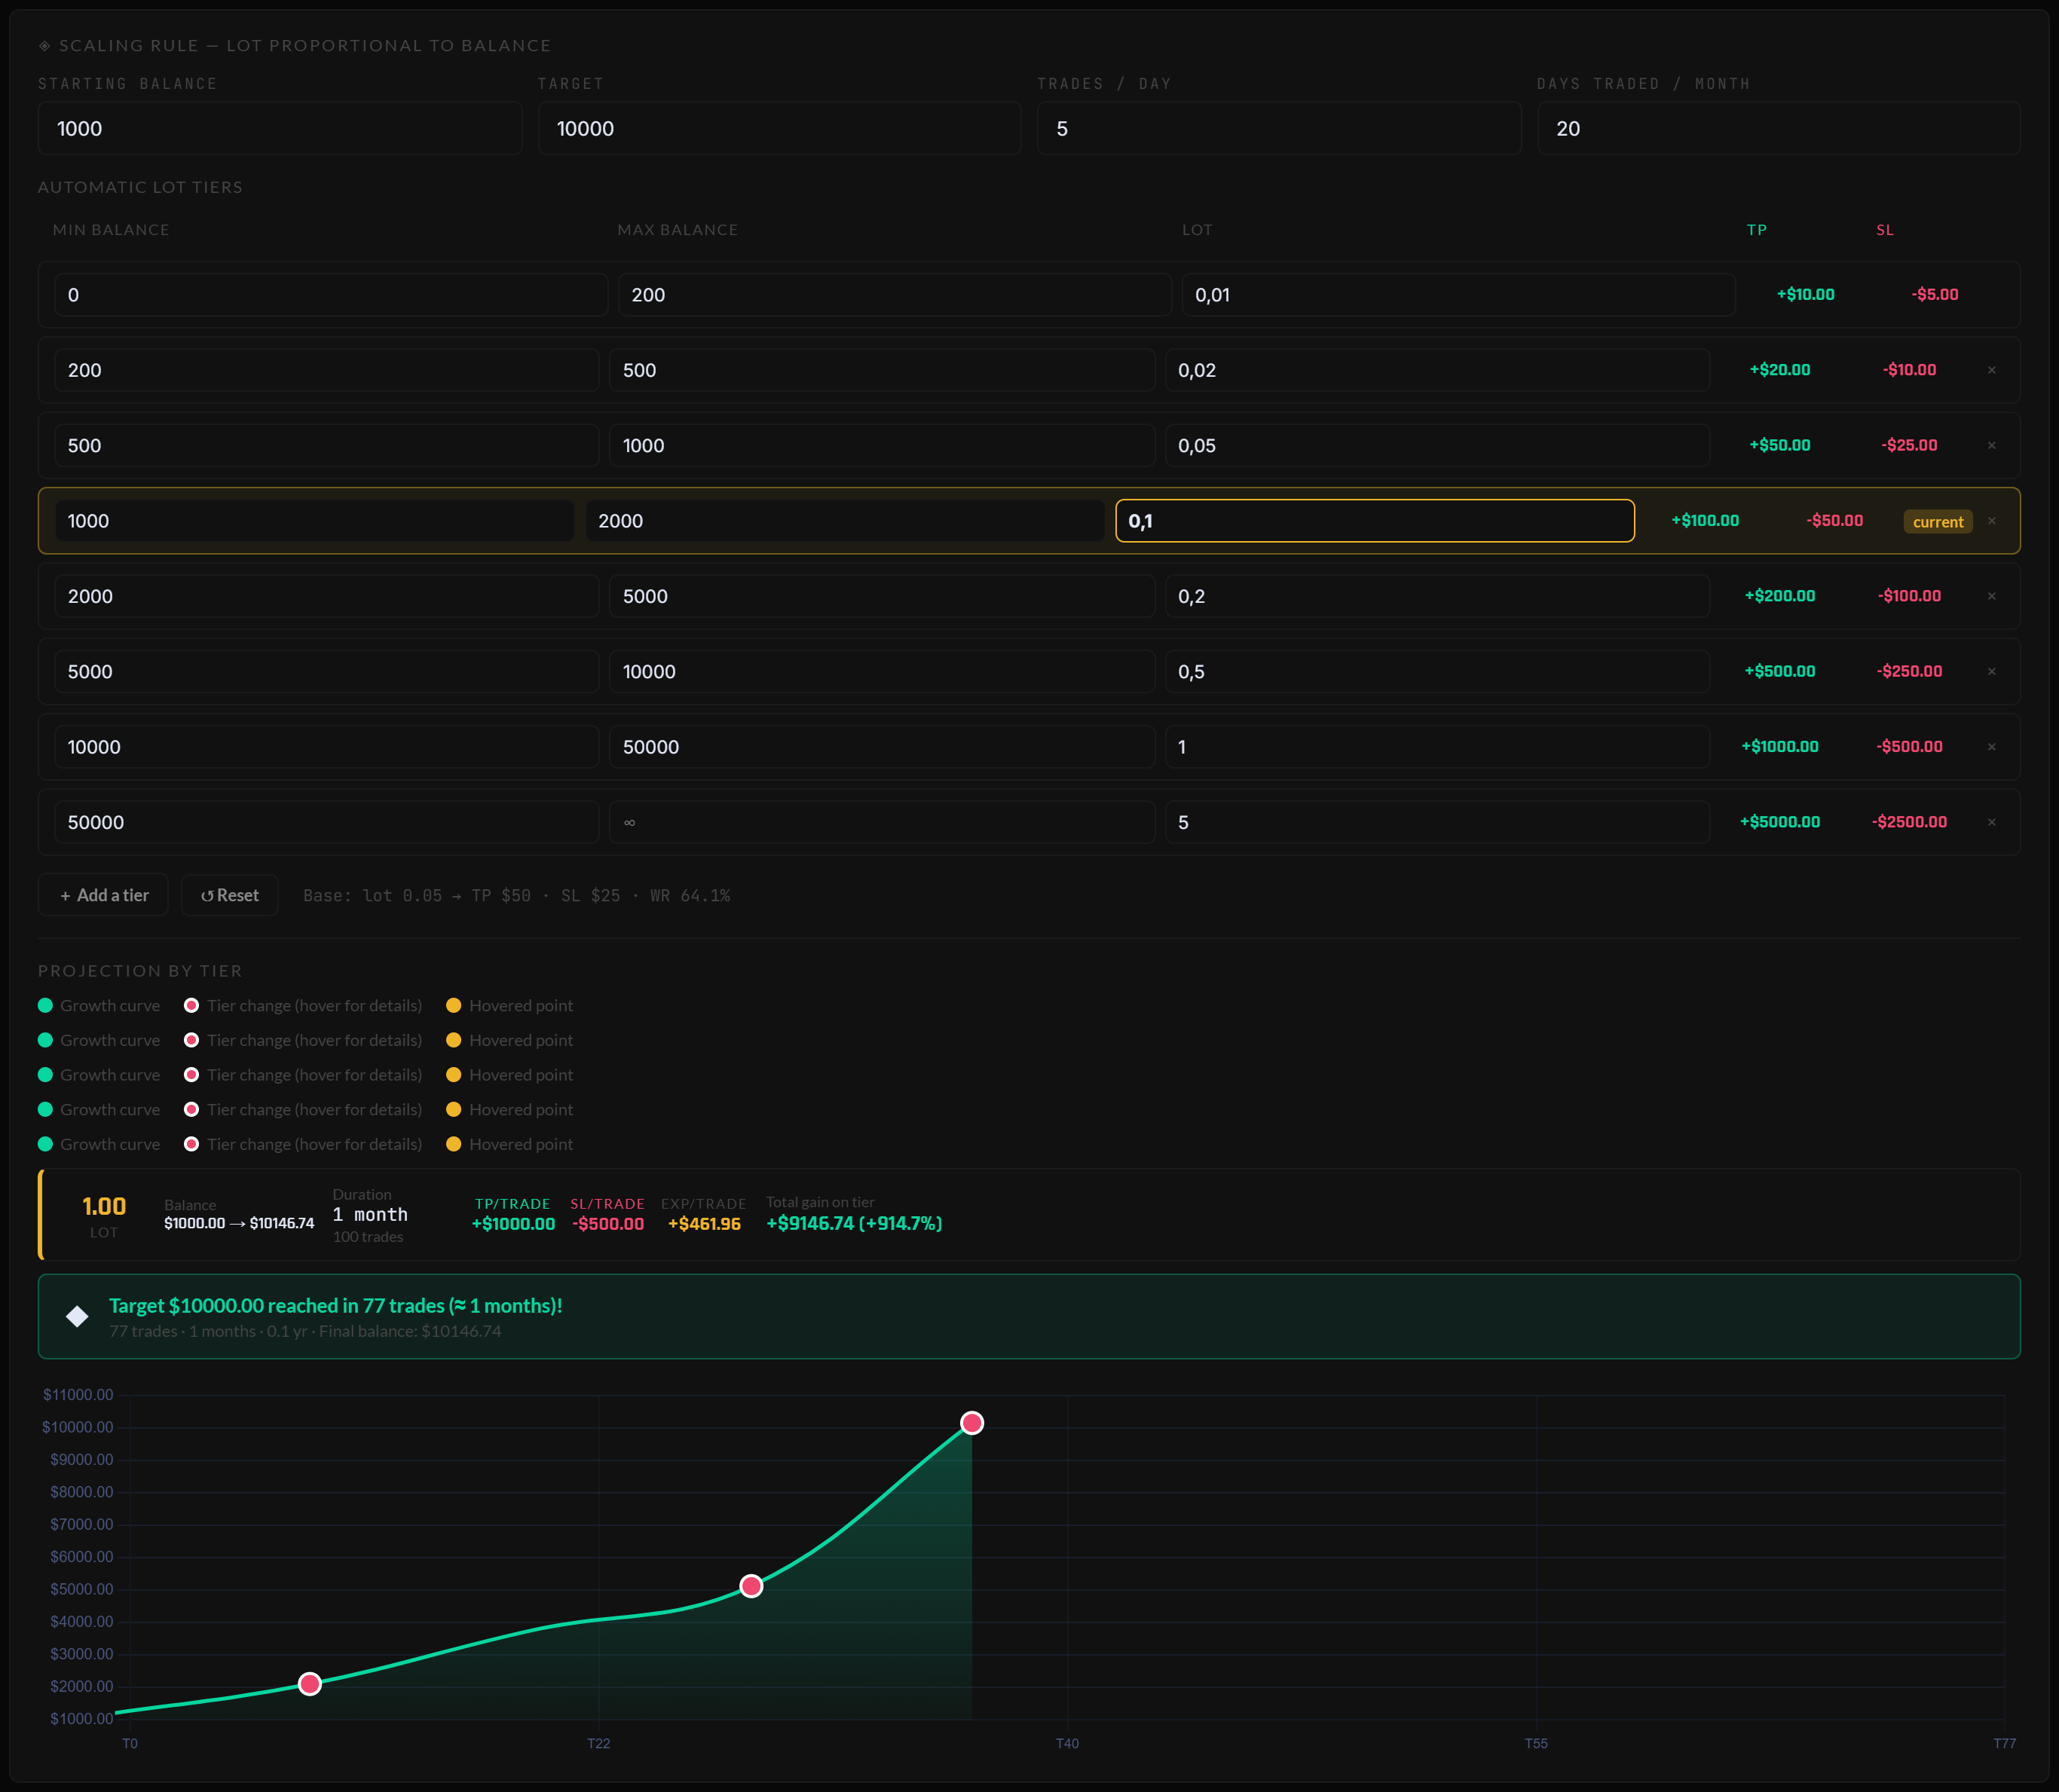
The automatic ladder: one row per balance bracket. The row matching your current balance is tagged “current”.
Axel generates a ladder of balance brackets, each with its lot size — e.g. $0–200 → 0.01, $500–1,000 → 0.05, $1,000–2,000 → 0.10. Two columns on the right translate each tier into money: what a full TP and a full SL represent at that lot size (using your classification ratios). That’s the number to stare at: “at tier 0.5, one stop costs $250 — can I sit through three of those?”
- Every cell is editable — adjust brackets or lot sizes to match your own plan (or your prop firm’s rules).
- ✕ removes a tier; the last bracket runs to ∞.
- The tier matching your current balance is tagged “current” — that’s the size the plan says you should be trading today.
3. Read the projection
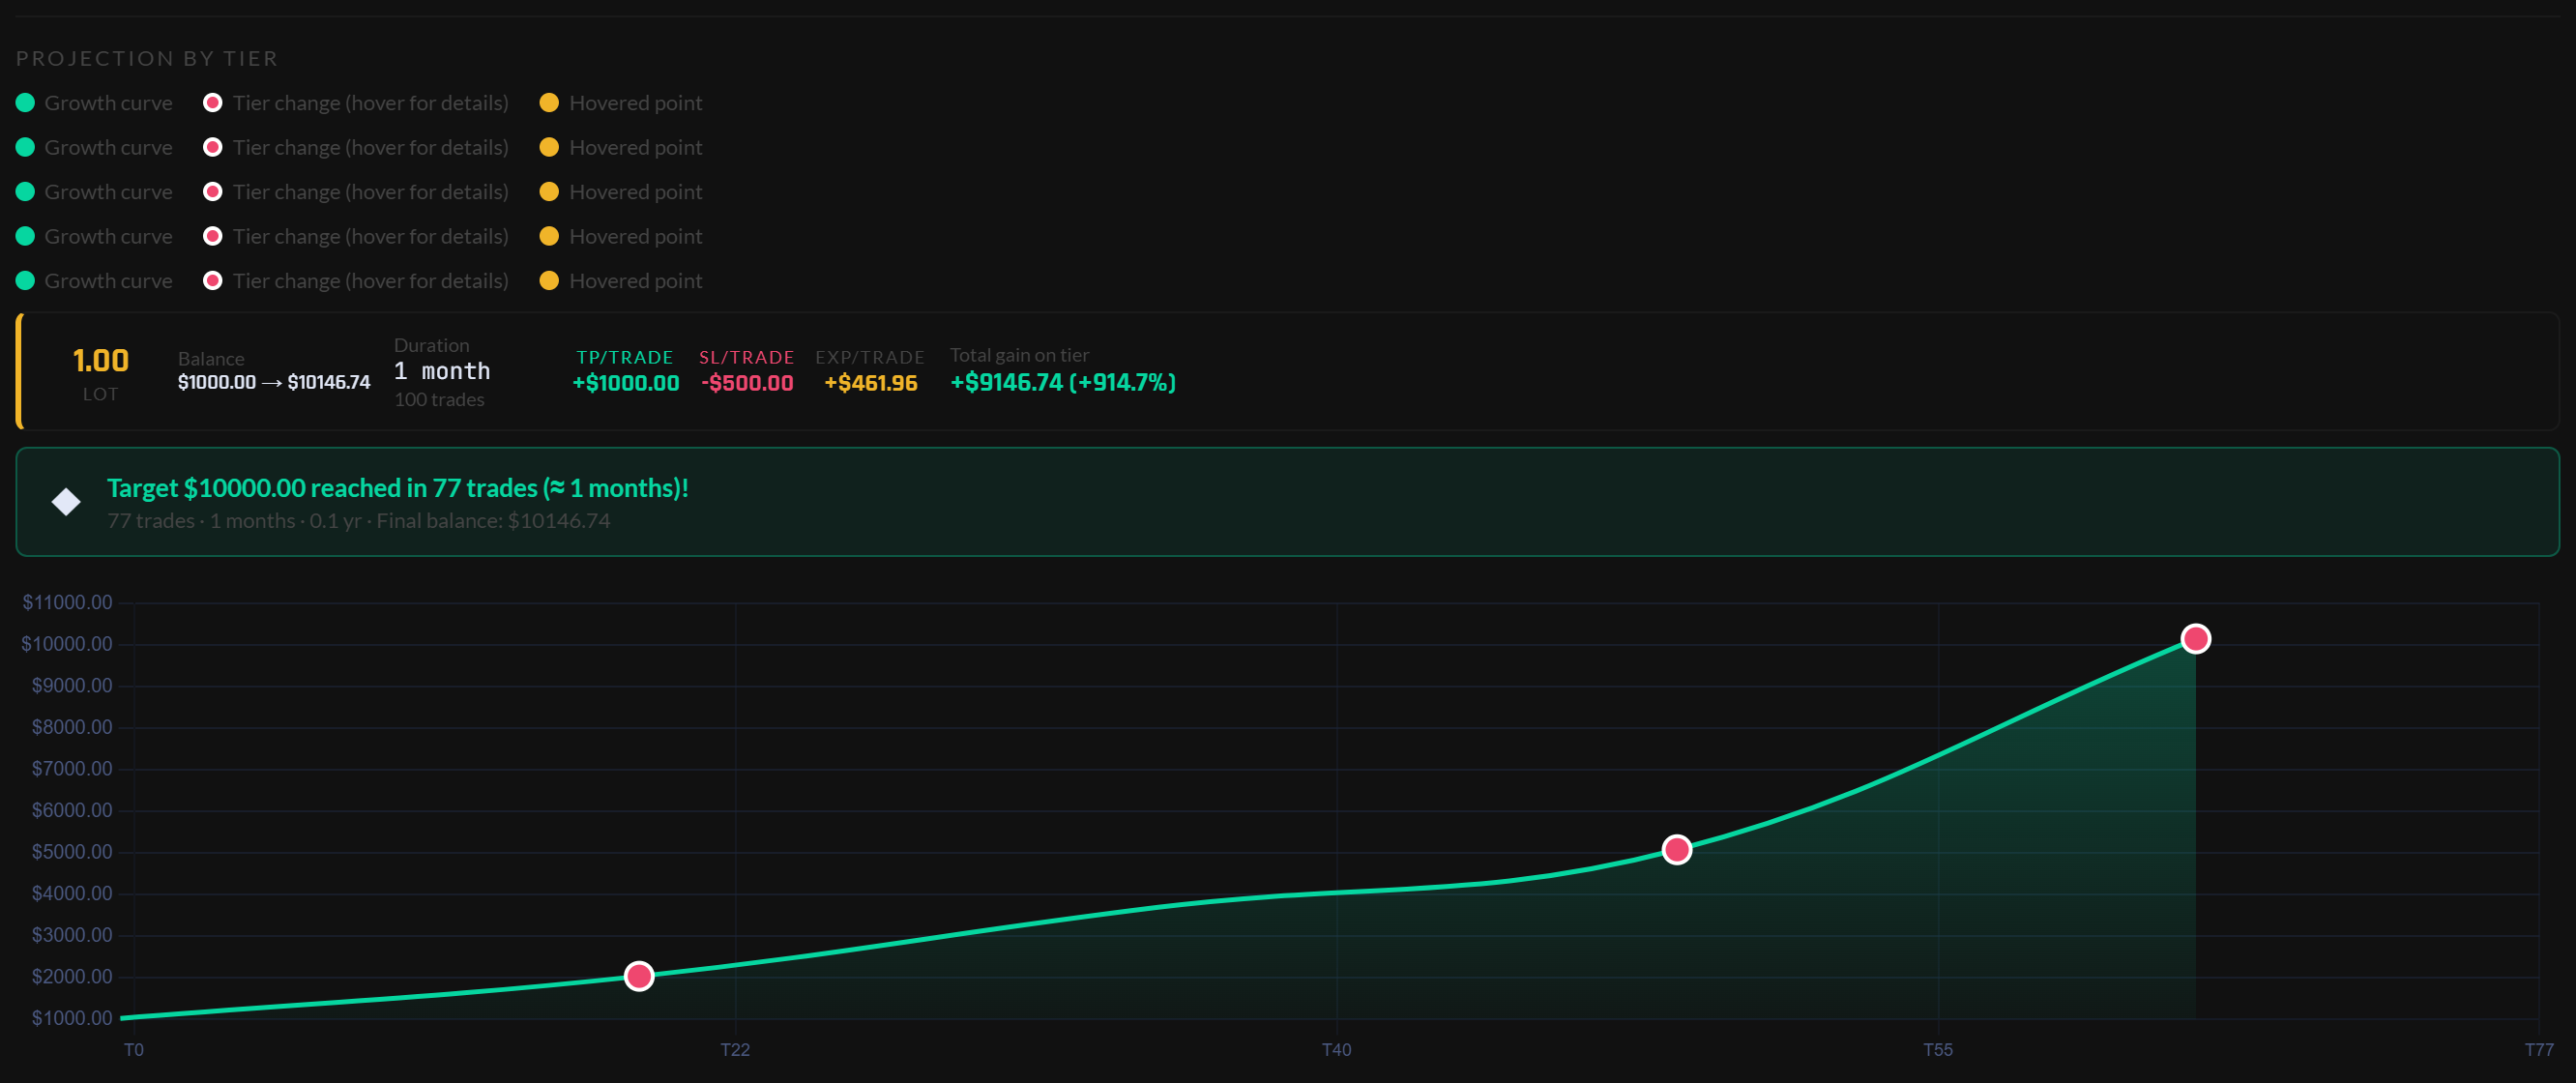
Stage by stage: how long each tier takes, and the projected date you reach the next one.
Below the ladder, Axel simulates your climb: for each stage it applies your real expectancy scaled to that tier’s lot size, at your stated pace, and shows how many trading days the stage takes and when you cross into the next bracket — down to the projected date you hit the target. The curve at the bottom draws the whole path: compounding makes it steepen as tiers rise, which is exactly the point.
Why the early tiers feel slow
At 0.01–0.02 lots, even a good expectancy produces small dollar amounts — the first brackets take the longest. That’s not a flaw in the plan; it’s what protects a small account from a losing streak while your edge proves itself. If the early stages look unbearably long, the honest fixes are more trading days or a better expectancy — not skipping tiers.