Dashboard overview
What every element on the Dashboard means — KPIs, day score, alert banners, and the widget grid.
The Dashboard is a grid of “bubbles” (widgets), each showing one view of your performance. Nine widgets are on by default; a dozen more are optional. Everything is rearrangeable — see Customize your layout.
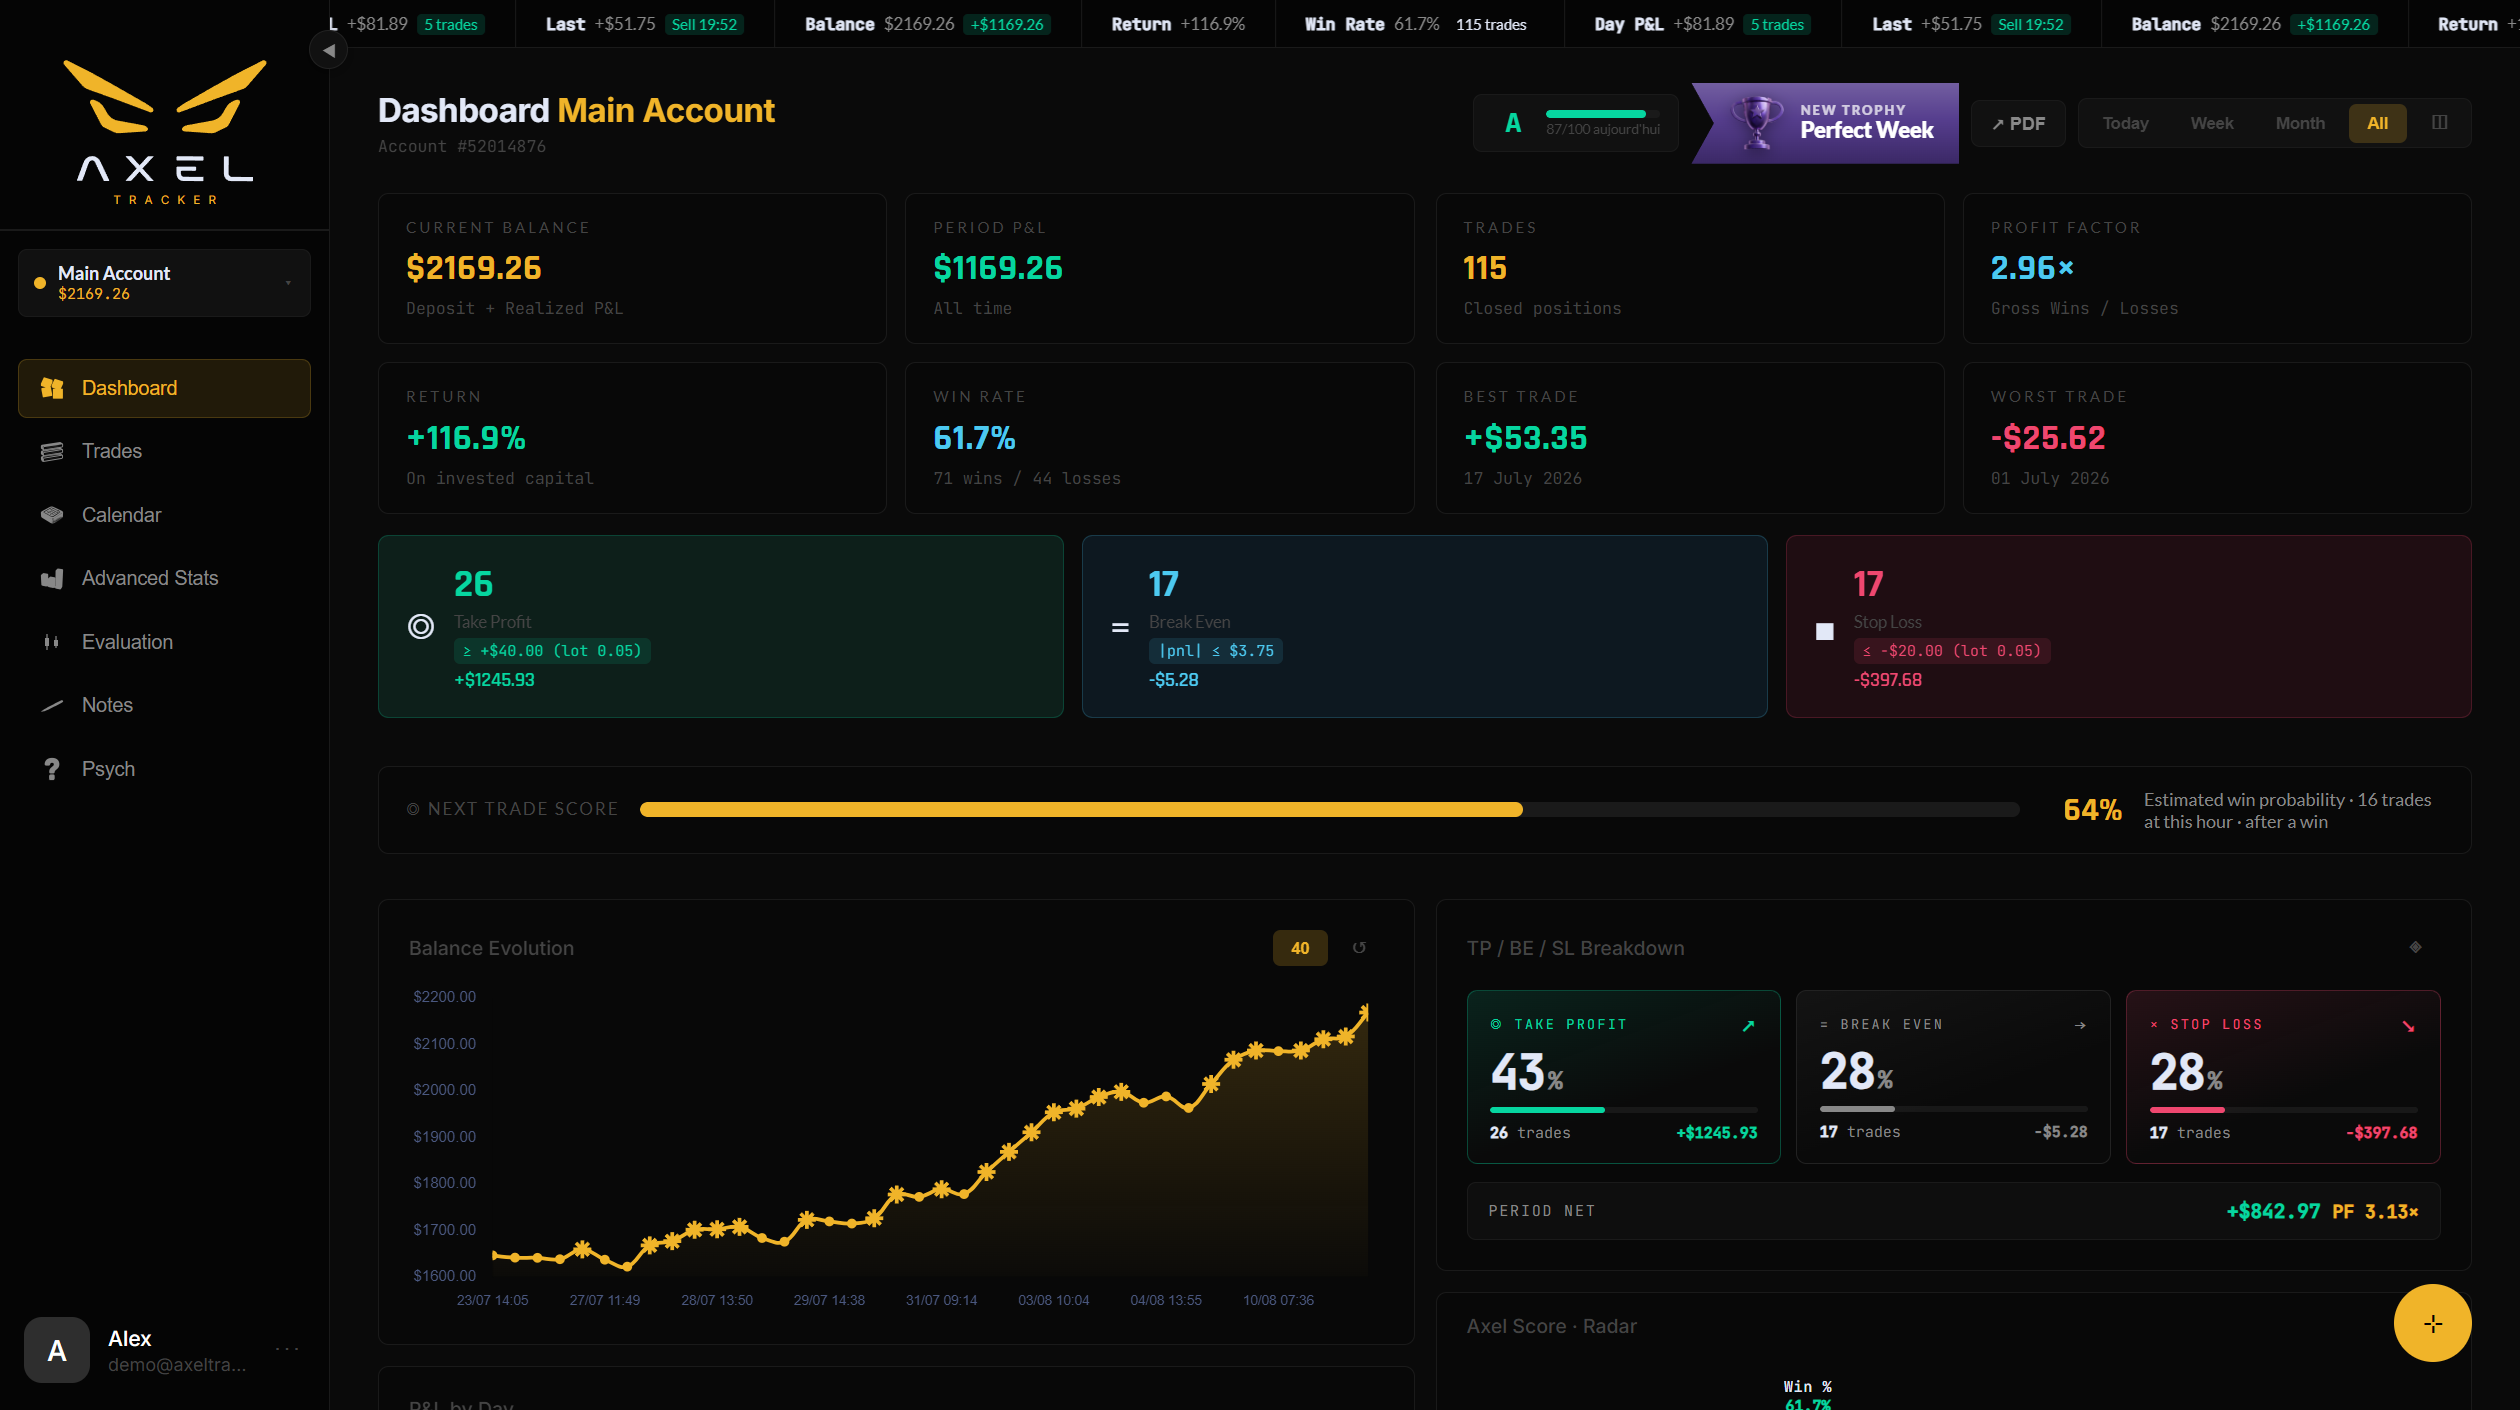
The header row
- Title — shows the account’s main instrument, and under it the period currently displayed.
- Day score — a letter grade (A–F) summarizing today’s session; click it for the detailed breakdown of what moved it.
- ↗ PDF — opens the PDF report dialog.
- Period filter — Today / Week / Month / All, plus a calendar button for a precise day or a date range. Every widget follows this filter. See Date ranges.

The period filter — every widget on the page follows it.
Alert banners
- High-impact news (3★) — when the economic calendar has 3-star events today, a banner lists them so you don’t get surprised mid-trade.
- Overtrading alert — appears when today’s trade count runs far above your usual pace.
- Trophy unlocked — a slide-in banner celebrates each new achievement (can be muted: Settings → Accounts → Celebrations).
The nine default widgets
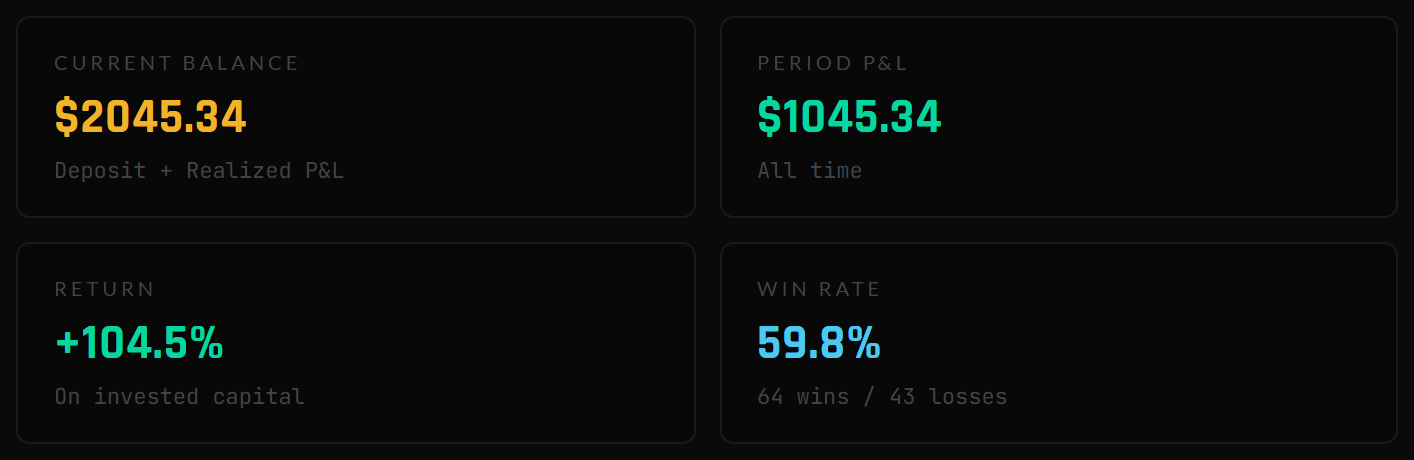
KPIs — Performance: balance, period P&L, return, win rate. Hover any KPI for its tooltip.

The TP / BE / SL banner: your outcomes for the period, with the thresholds that produced them.
| Widget | What it shows |
|---|---|
| KPIs — Performance | Current balance · P&L for the period · Return on invested capital · Win rate. Hover a KPI for its tooltip. |
| KPIs — Trades | Trade count · Profit factor · Best trade · Worst trade. |
| TP / BE / SL banner | A strip summarizing your outcomes for the period at a glance. |
| Next-trade score | A probability read on your next trade, based on your recent behavior (streaks, discipline, time of day). Informational — not a signal. |
| Balance evolution | Your equity curve. Click it to toggle between views; long-press resets. |
| TP / BE / SL split | The distribution of your outcomes as a donut. |
| Axel Score · Radar | A radar of your trading profile: discipline, regularity, risk control, performance… |
| P&L by day | Bars per weekday — spot your strong and weak days. |
| P&L by direction | Buy vs Sell performance, side by side. |
Every number follows the selected period and the selected account. If a figure looks off, check those two first.
Still stuck? Contact support — or send feedback from the app: profile menu → Settings → Feedback.