The PDF report
Generate a clean performance report: periods, the objectives section, and the integrity rule.
The ↗ PDF button on the Dashboard generates a formatted report of your performance — equity curve, KPIs, risk ratios, monthly table.
Choosing the period
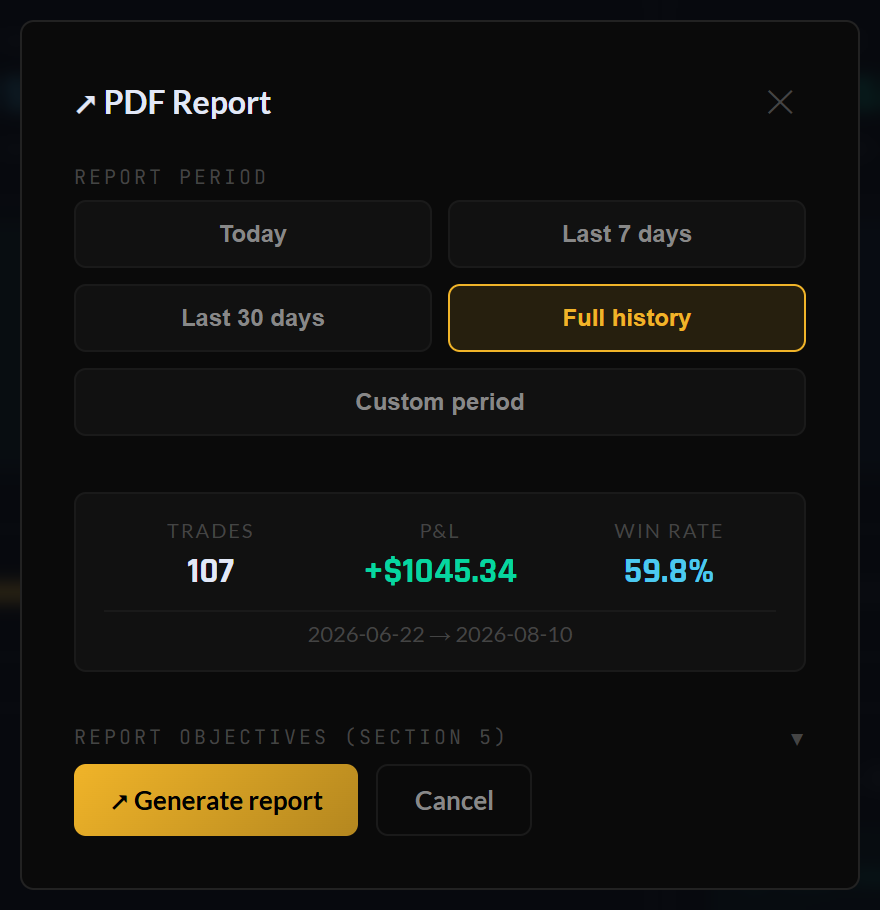
The report dialog: pick a period, preview its stats, optionally fill your objectives.
Today · Last 7 days · Last 30 days · Whole history · or a custom date range. A live preview shows the period’s key stats before you generate.
The objectives section
Optionally, fill in your targets — monthly return, max drawdown, minimum profit factor, target win rate, plan discipline, capital goal — and the report includes them next to your actuals: a self-audit page.
The integrity rule
A note on the ratios
Sharpe, Sortino and the drawdown figures in the PDF are computed from the same daily-return engine as the Stats page — the two always agree. Value-at-risk is expressed per trade, and monthly drawdown is measured on your real equity.