Advanced metrics — Sharpe, Sortino, Kelly, Z-score, expectancy
What each professional metric means, and how Axel computes it.
Advanced Stats → Stats is the quant card of your journal. Definitions first, then how to read them.
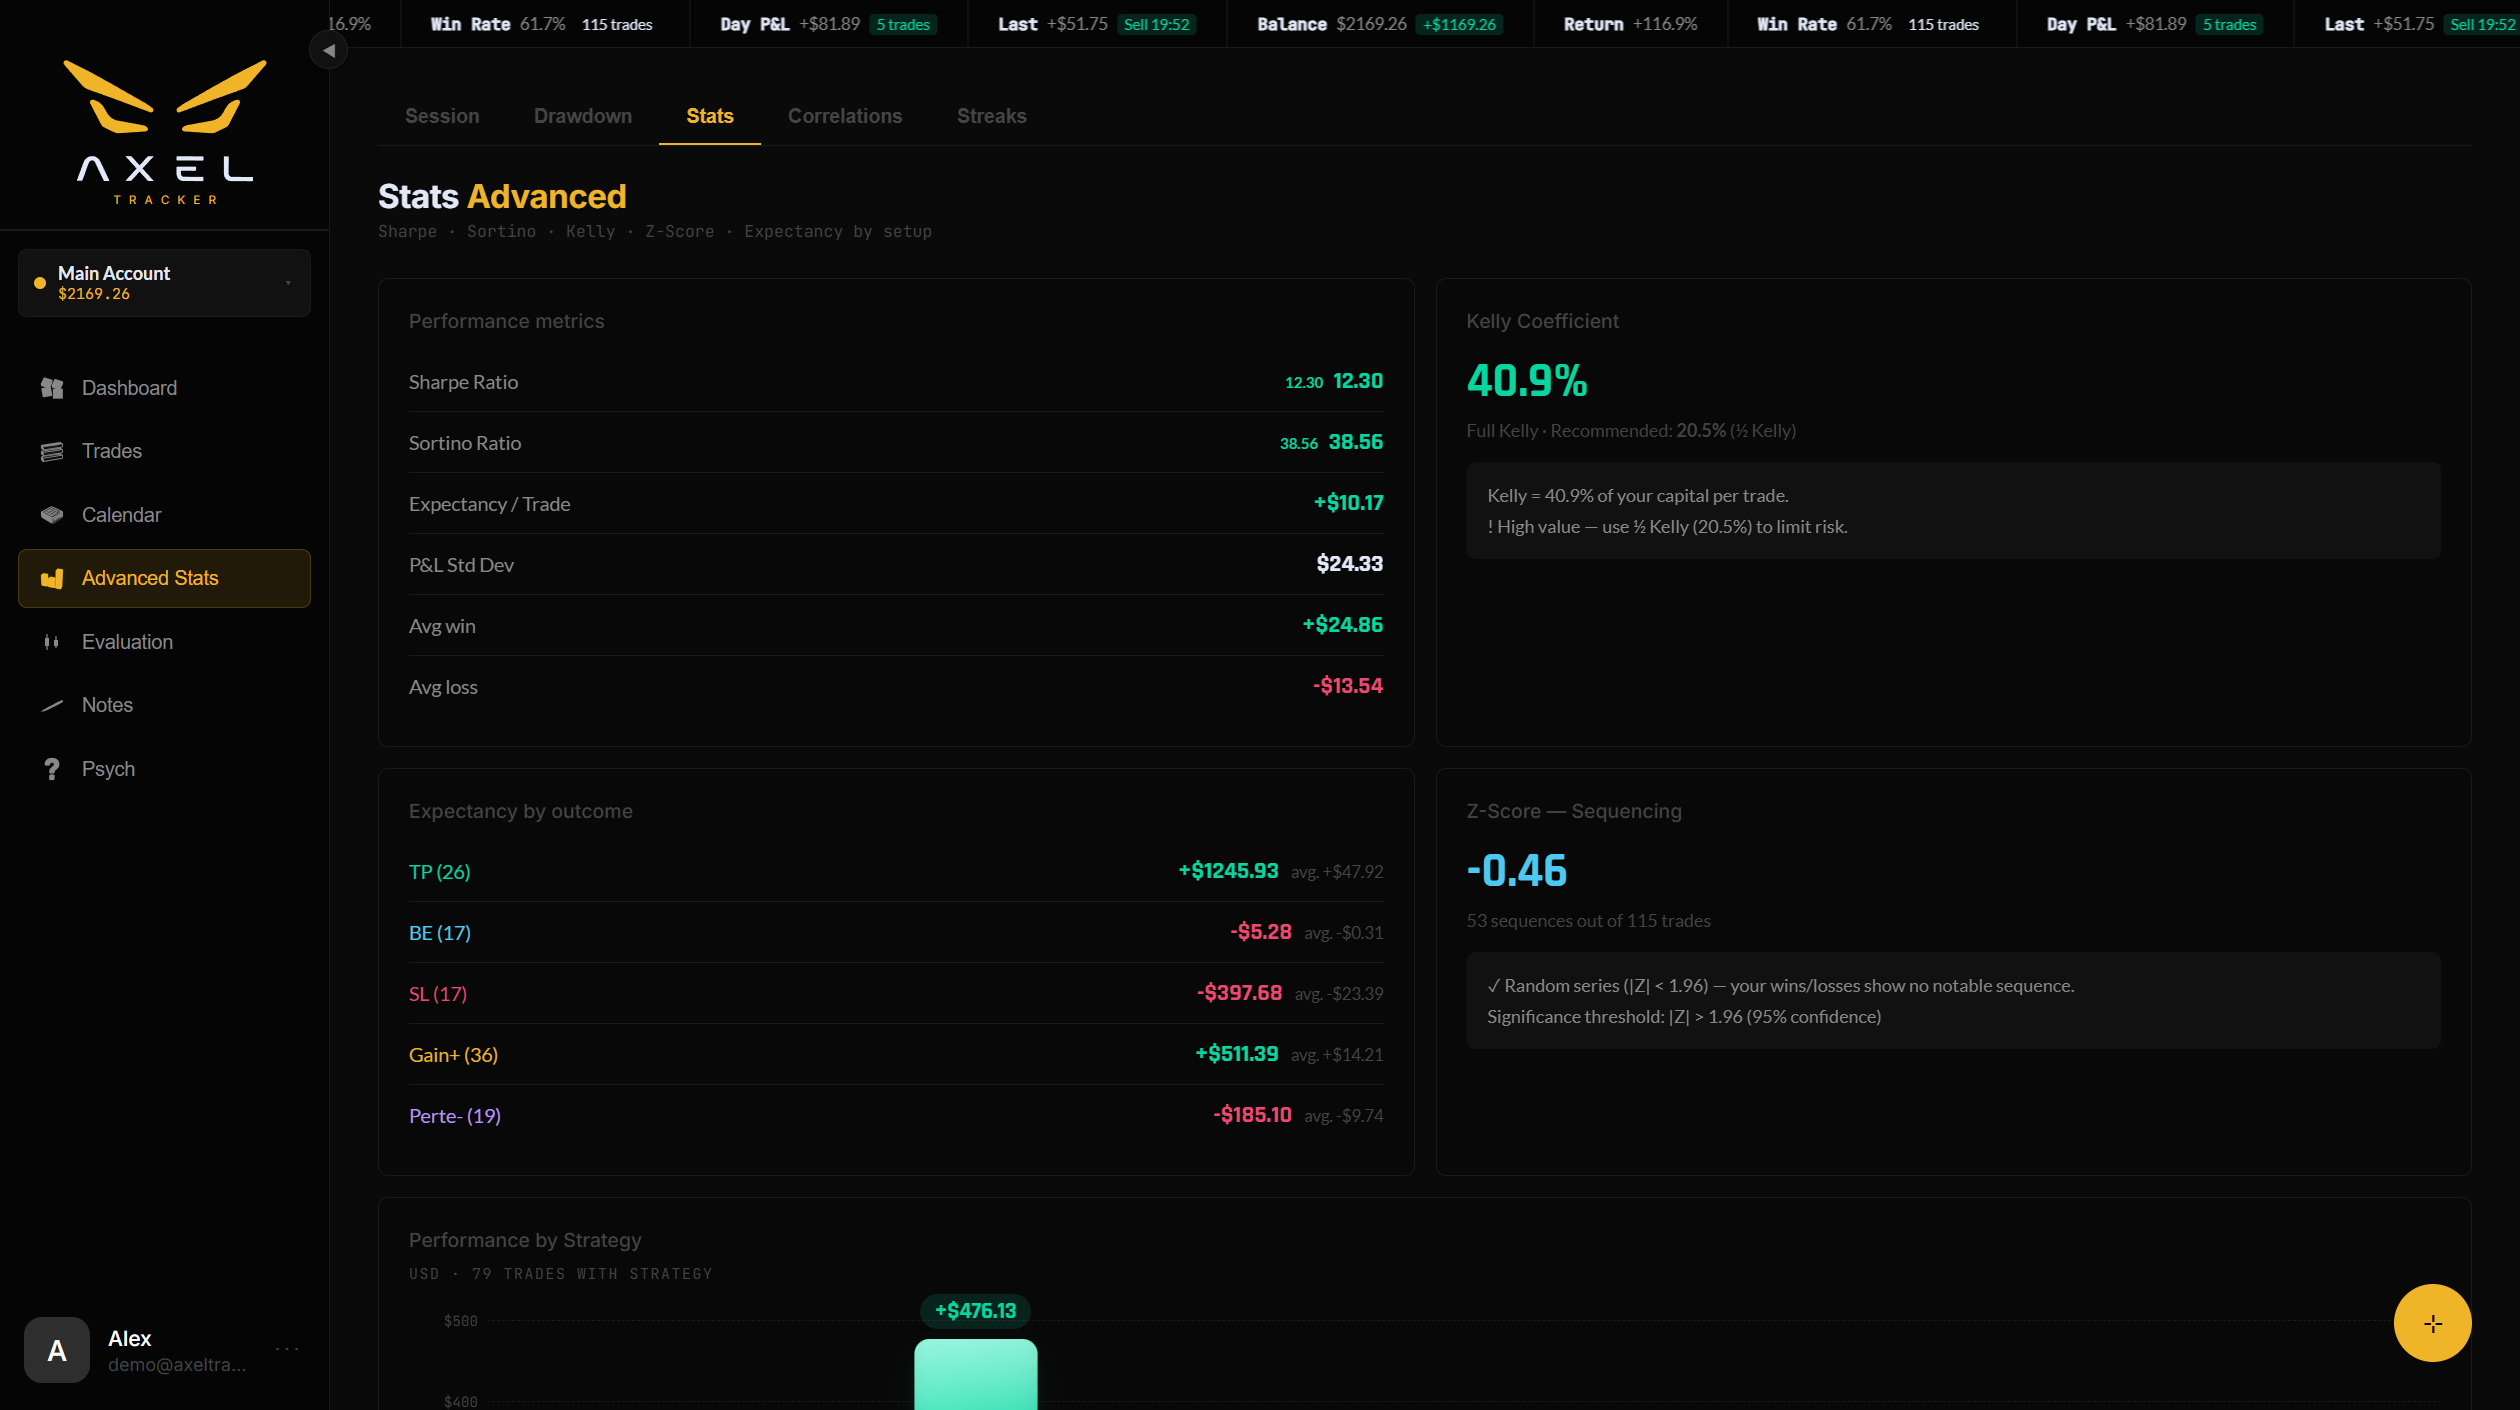
Performance metrics
| Metric | What it tells you |
|---|---|
| Sharpe ratio | Return per unit of volatility, computed on your daily P&L series. Above ~1 is solid, above 2 is excellent. |
| Sortino ratio | Like Sharpe, but only downside volatility counts — it doesn’t punish you for big winning days. |
| Expectancy | Average P&L per trade. Positive expectancy is the entire game. |
| Win/loss ratio | Average win ÷ average loss. |
| Profit factor | Gross profit ÷ gross loss. |
Sharpe and Sortino share one computation base (daily returns) everywhere in Axel — the Stats page and the PDF report always agree.
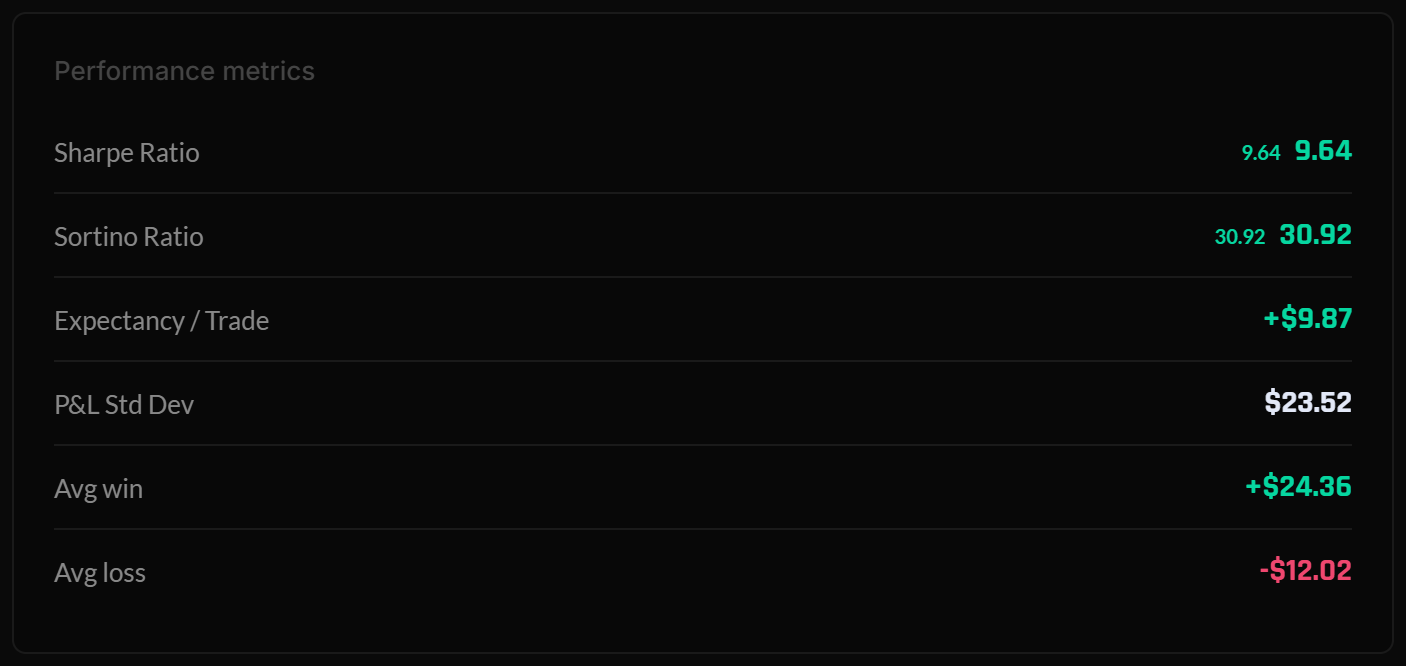
Kelly coefficient
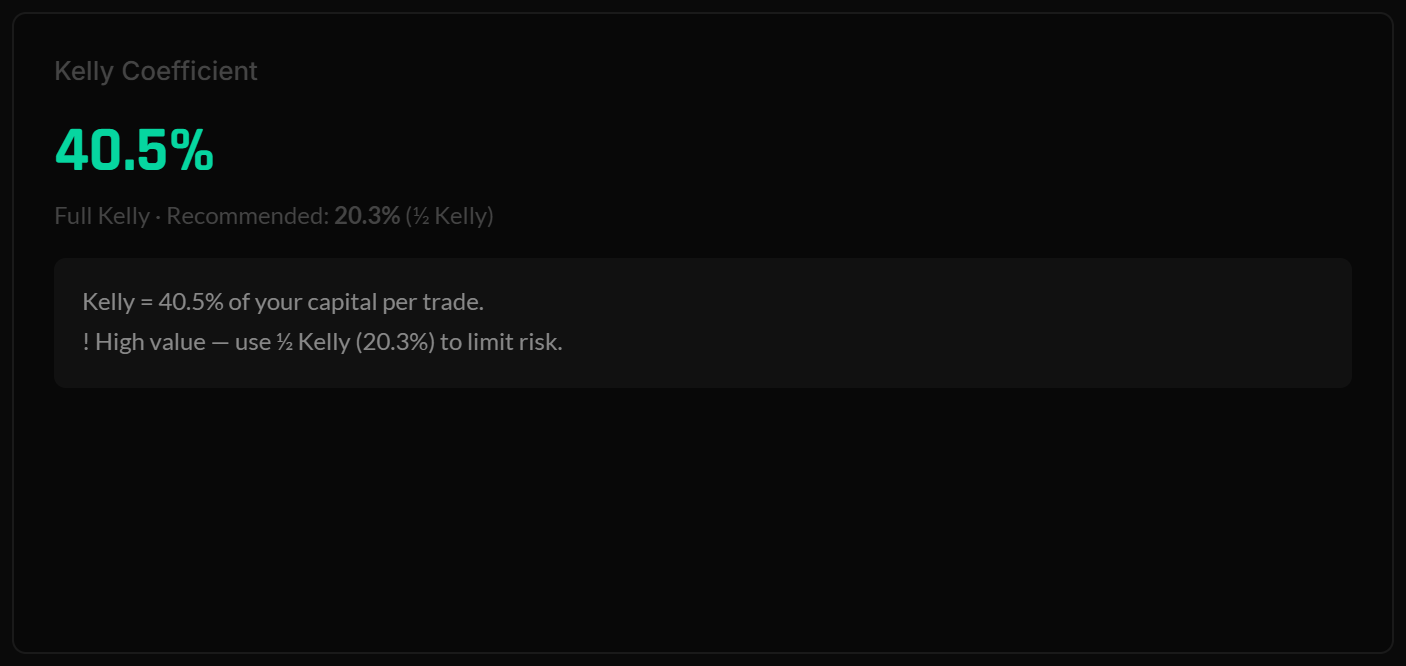
The Kelly formula estimates the theoretical optimal fraction of capital to risk per trade, from your win rate and win/loss ratio. Axel shows it as a reference point — practitioners typically size at a fraction (¼ to ½) of Kelly, because the formula assumes your edge is stable and known, which it never fully is. Only decided trades (non-zero P&L) enter the calculation.
Z-score — are your streaks random?
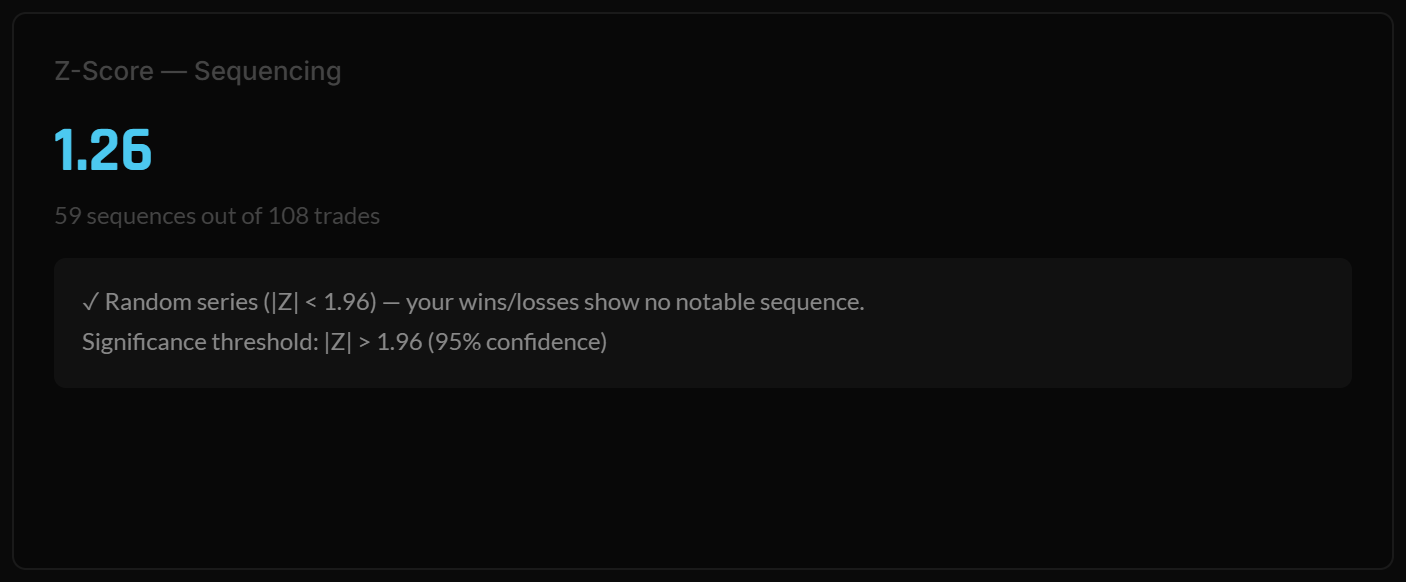
The Z-score tests whether your wins and losses cluster more (or less) than chance would produce. A strongly negative Z-score = streaky results (wins follow wins, losses follow losses) — which argues for reducing size after losses. Near zero = your sequence looks random, and streaks shouldn’t change your sizing.
Expectancy by outcome
The same expectancy, split by TP / BE / SL / Gain+ / Loss− — it shows which outcome class actually drives your P&L.
Performance by strategy
The histogram of P&L per strategy. Strategies come from your notes tagged ▪ Strategy; trades are attributed in the trade form.