The monthly view
Your month at a glance: P&L per day, monthly KPIs, yearly performance, and day drill-down.
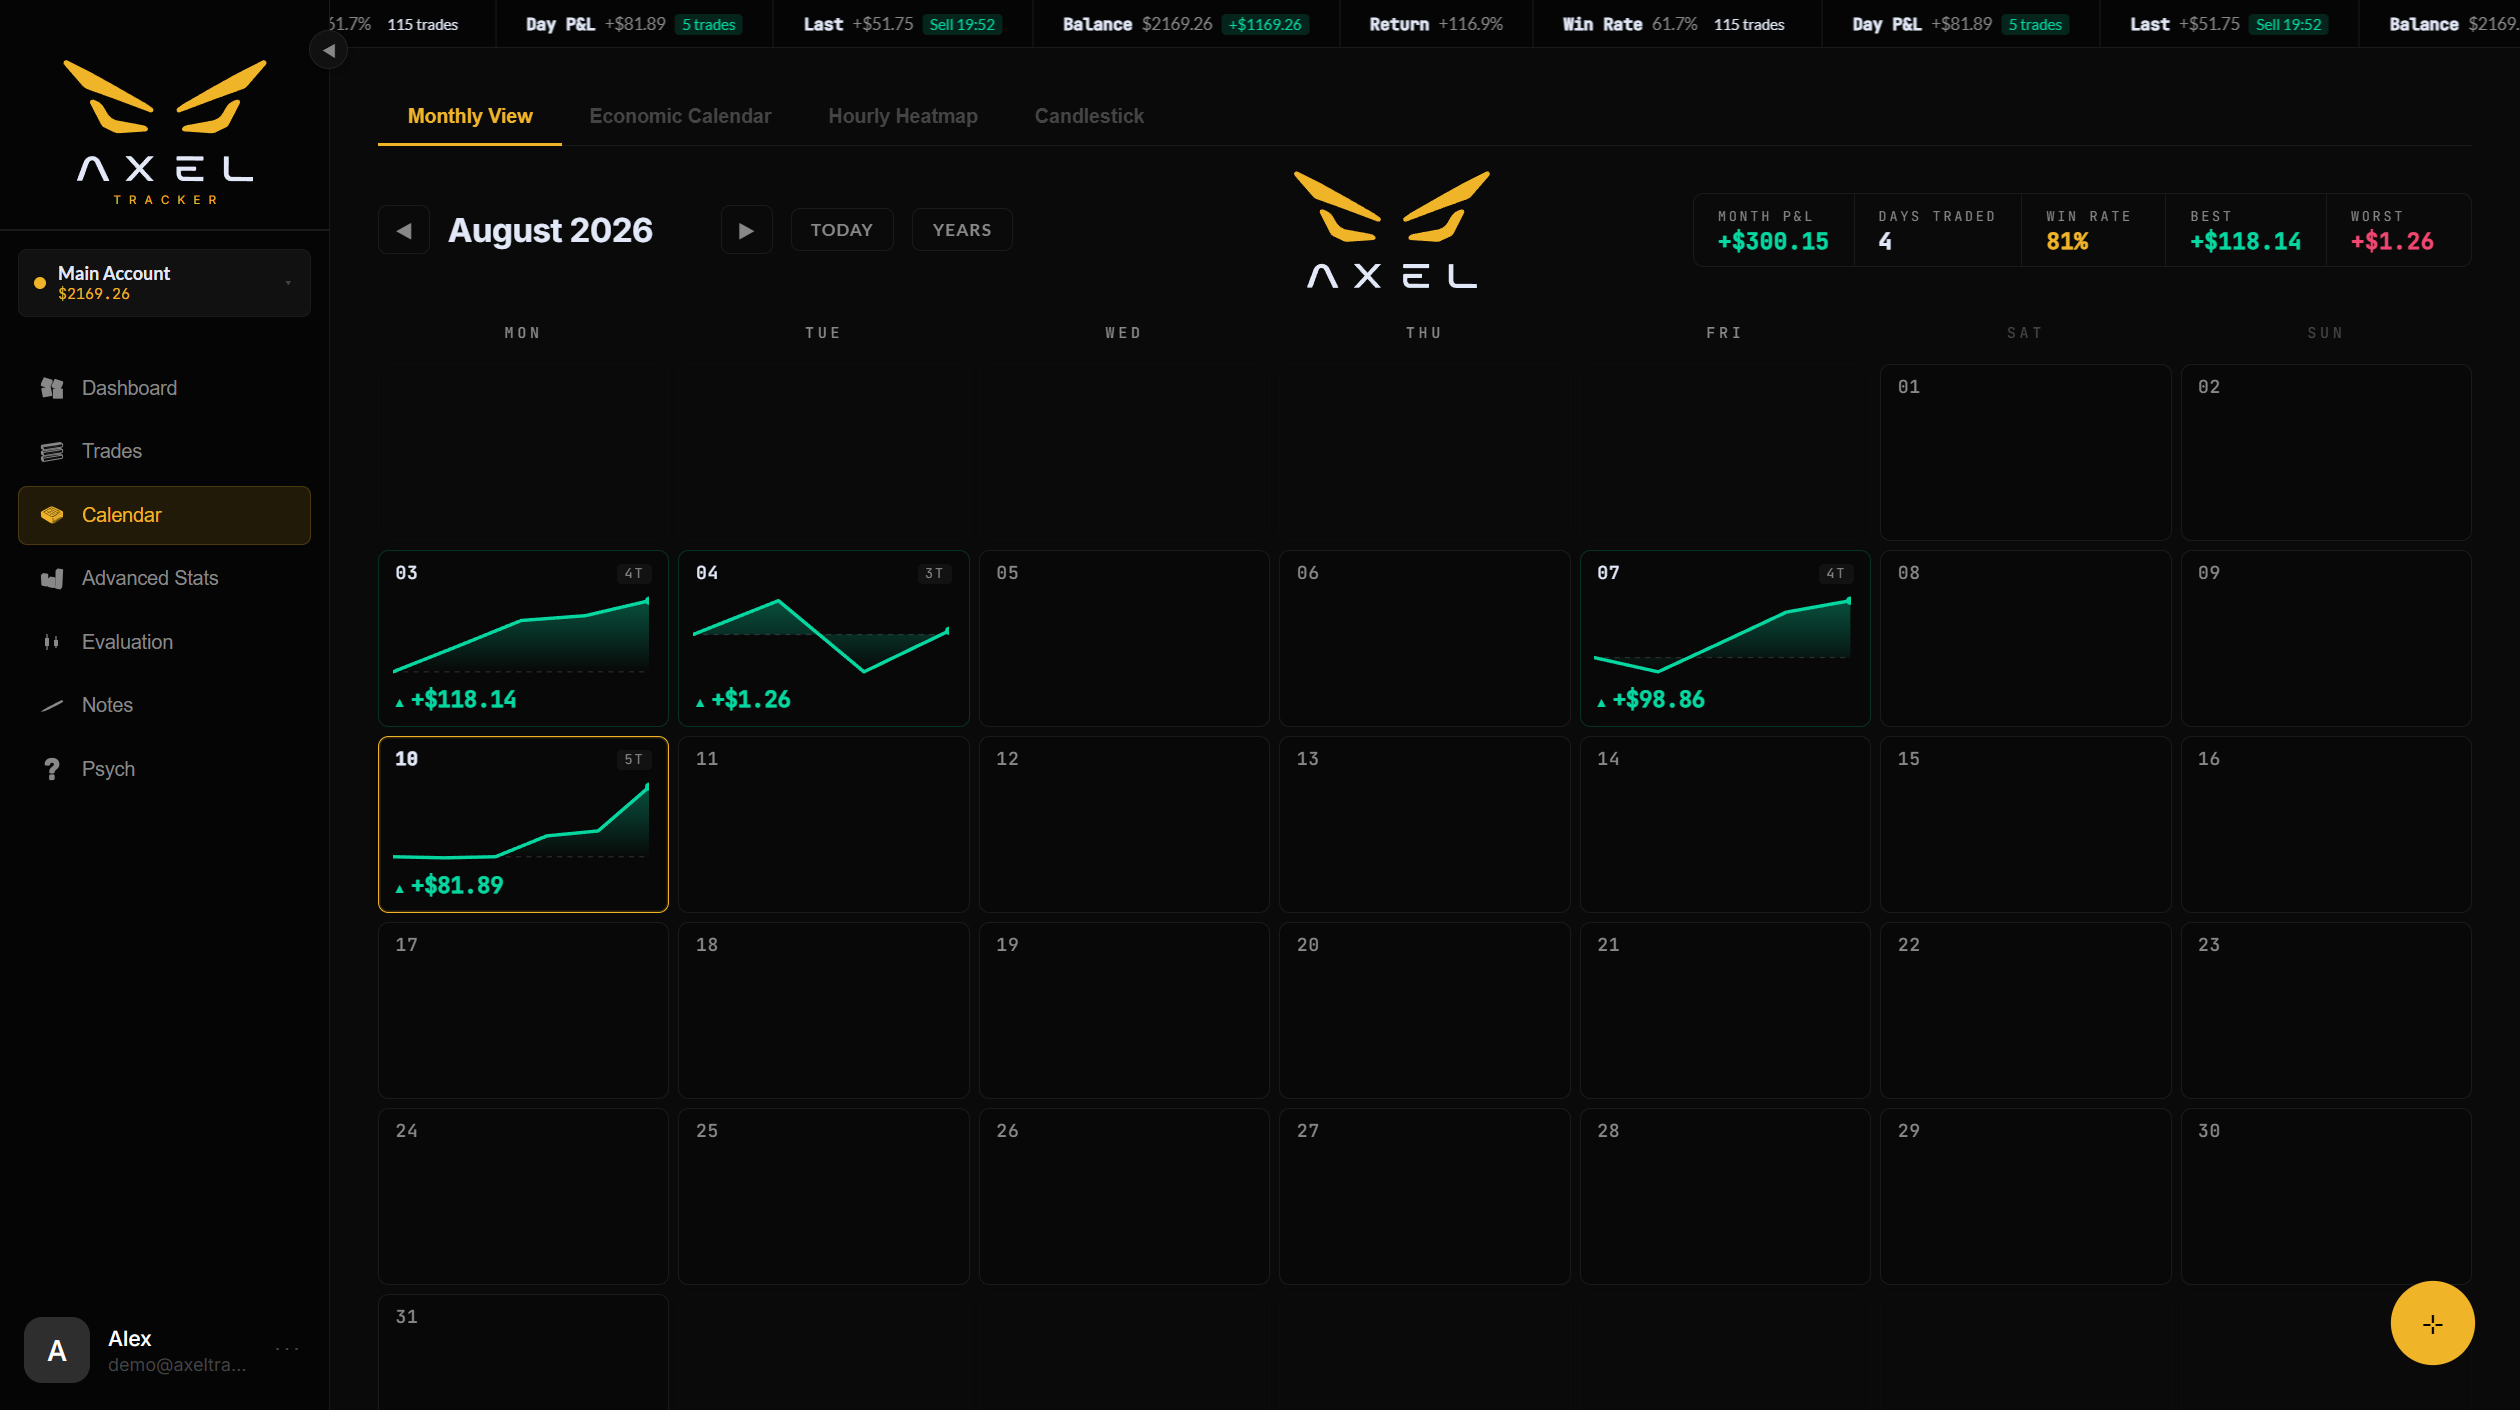
Calendar → Monthly view paints each trading day green or red with its P&L, so a month reads like a heat map of your consistency.
Navigating
- ◀ ▶ — previous / next month.
- Today — jumps back to the current month.
- Years — unfolds the yearly performance panel above the grid: every month of every year, so you can compare seasons.
The monthly KPI strip
Top-right of the calendar: Month P&L, Days traded, Win rate, Best and Worst day — all for the displayed month.
Day drill-down
Click any day to open its trade table below the grid: time, direction, instrument, P&L, outcome and note for each trade of that day.
A gold dot marks today. Green = the day ended equity-up, red = equity-down.
Still stuck? Contact support — or send feedback from the app: profile menu → Settings → Feedback.